


Infrastructure, steaming containerships, and food waste

After months of negotiations, the Bipartisan Infrastructure Framework (BIF) may finally reach the Senate floor next week. Any debate that the tries to close a $2.6 trillion investment gap is bound to be challenging. And that $2.6 trillion is the gap in investment needed for critical infrastructure systems, including airports, bridges, dams, electrical grids, roads, and other physical infrastructure.1
The $2 trillion American Jobs Plan (AJP) announced by the White House at the end of March attempts to fill some of that gap.2 Since then, negotiations have run the gamut from how much to spend, what to spend it on, and how to pay for it. On some days, negotiations are close to wrapping up. On others, it’s imploding.
This week, a bipartisan group of 22 senators finally reached agreement on delaying a Medicare rule to help pay for some of the $579 billion deal for physical infrastructure. The Medicare rule would eliminate rebates to drug companies so they will — in theory — reduce drug costs outside of Medicare. Delaying the rule will reduce Medicare expenses backed into the current budget by about $177 billion over the next decade. That windfall will transfer to the infrastructure package. Naturally, drug companies are lobbying against the rule change, but it appears to have the support of Senate Finance Chair Ron Wyden and the bipartisan infrastructure team.3
With the August 9th recess deadline looming, some Senate Democrats made last-minute efforts to voice their concerns in what White House Press Secretary Jen Psaki calls the “the messy process of legislating.”4 Senator Tom Carper of Delaware wants the infrastructure plan to fund water and sanitation in a separate water infrastructure bill. Senators Chris Murphy and Richard Blumenthal also pushed more funding for the rail corridor between Washington, D.C. and Boston — the “Northeast Corridor” (NEC).
The U.S. rail network includes freight and passenger railroads. Private freight railroads operate approximately 140,000 miles of track and invest between a quarter to a third of revenue in capital expenditures and maintenance costs. To support these investments, they receive a federal tax credit of $0.50 for every dollar spent up to $3,500 per mile of track and bridge improvements.5 They invest on average over $260,000 per mile ($24.9 billion in total in 2018) each year. Since 2005, the tax credit has resulted in $4 billion in additional investment by the freight railroads.
Passenger rail service, in contrast, is funded (directly) by both public and private sources, including passenger revenues and state and federal funding. The NEC is the nation’s busiest passenger rail segment providing service to over 17 million Amtrak riders across eight states (Massachusetts, Rhode Island, Connecticut, New York, New Jersey, Pennsylvania, Delaware, and Maryland) and the District of Columbia. Amtrak owns most of the corridor and shares it with eight commuter railroads. The corridor faces a state-of-good-repair backlog of $45.2 billion — just the NEC — and infrastructure-related issues are the largest source of delays in the corridor. These delays caused 328,000 train-delay minutes in 2019 — equivalent to roughly 700 trips from Boston to Washington, D.C.6
Earlier this week, the infrastructure plan included $60 billion over five years for rail, with approximately half for the NEC. That $30 billion would make a dent in the repair backlog, but it’s not enough to improve or expand service. Thus, Senators Murphy and Blumenthal from the region are pushing for more, though neither indicated it would be a barrier to passing the plan.7
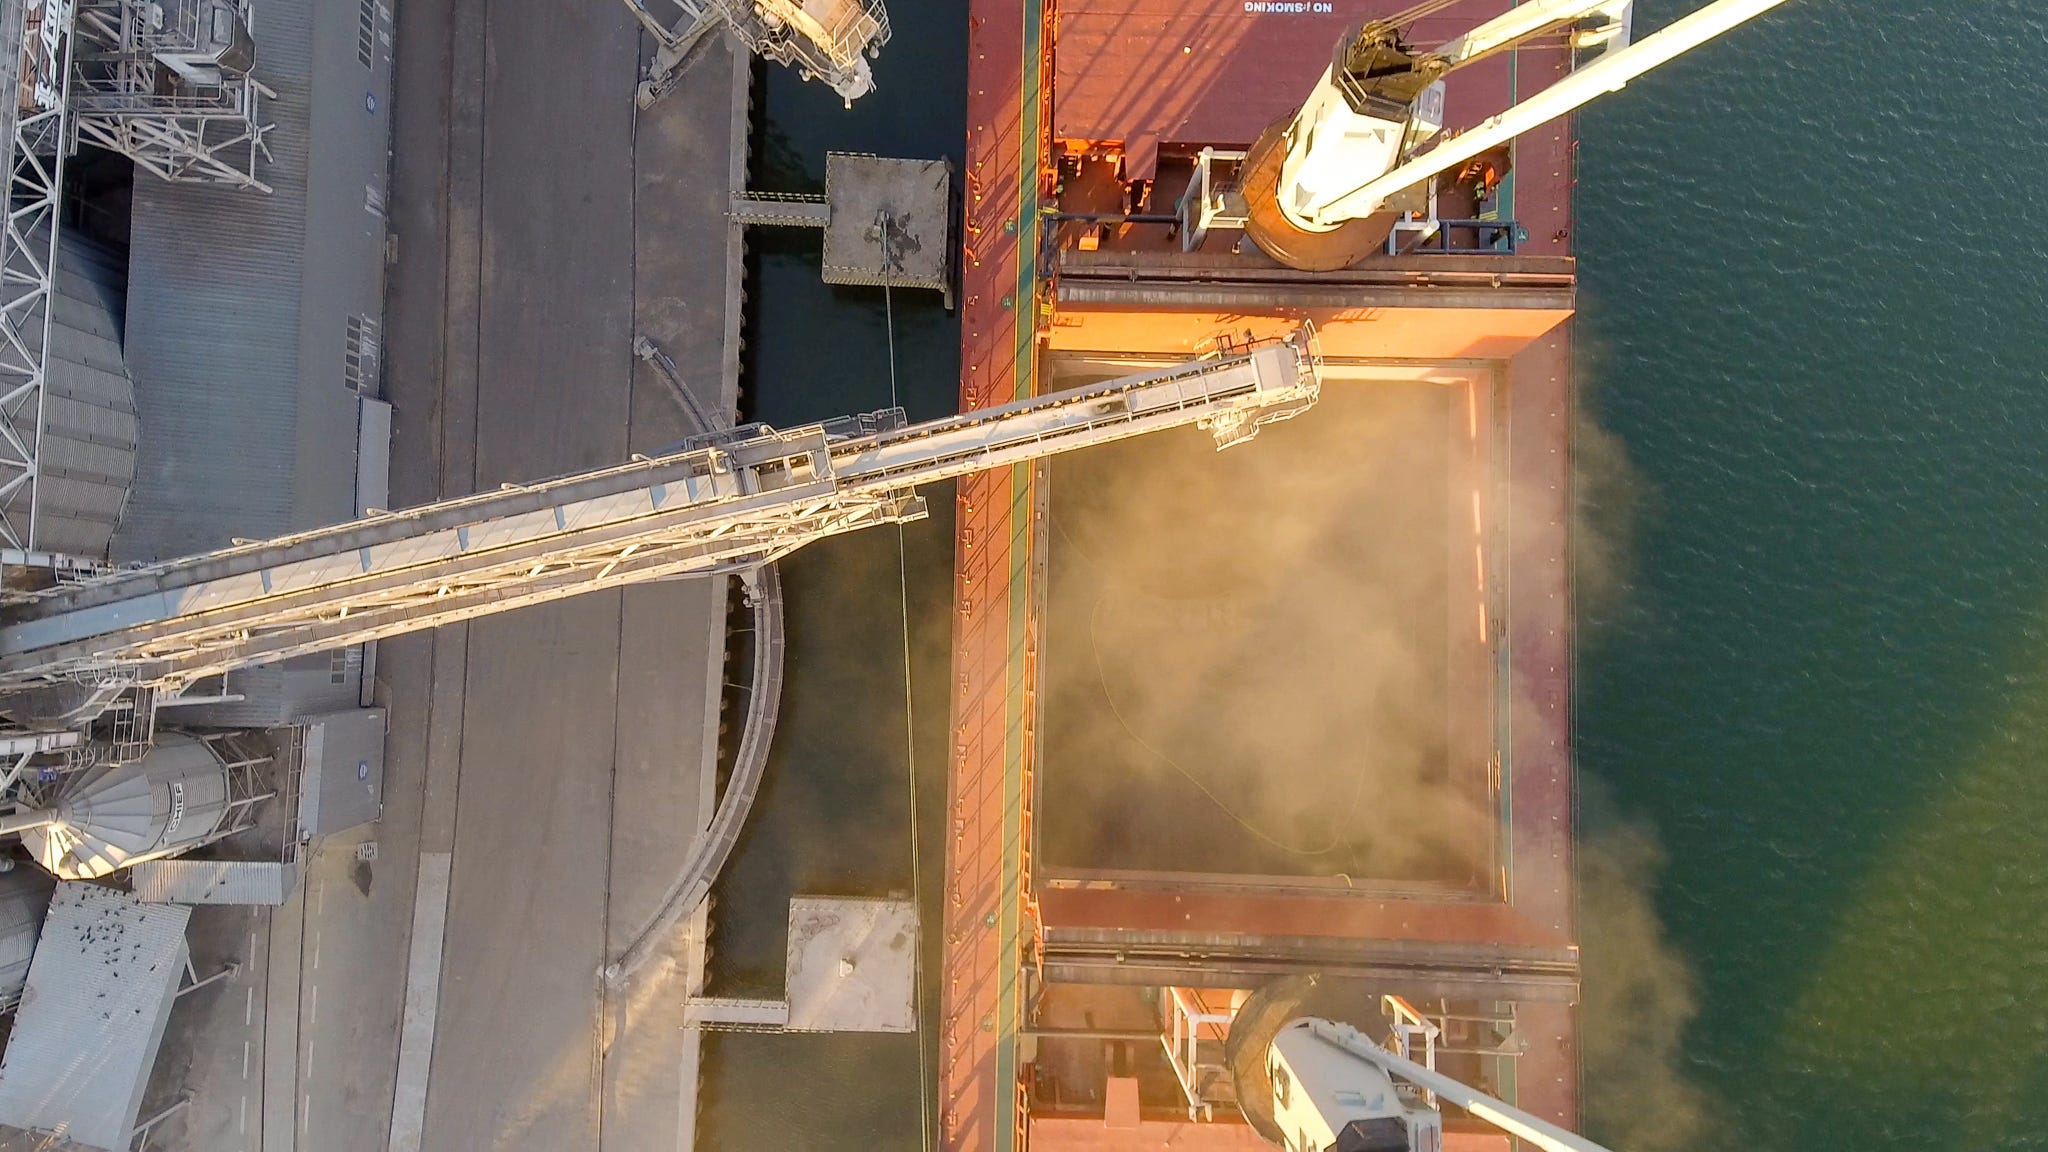
While the infrastructure plan steams to the Senate floor, containerships have picked up steam across the Pacific. To make up for schedule delays waiting at West Coast ports, containerships are literally going faster. After steadily reducing speed since early 2018, average global containership speed has increased by 1 knot (6-7%) over the last year.8
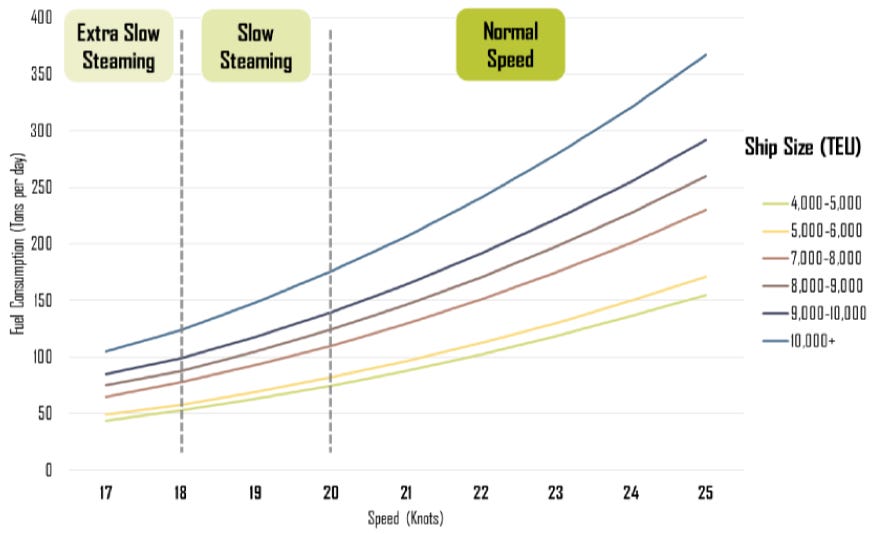
Speed is correlated with fuel consumption (see Figure 19), and thus fuel cost. With spot rates for containers at record highs, however, the shipping lines have determined that it’s more profitable to burn the fuel and reduce transit time.
The increased fuel consumption means greenhouse gas (GHG) emissions are rising as well, but according to some, this is merely a “politically sensitive side effect” and “negative for ESG reporting.”10 The contribution to climate change is not part of that calculus.
While the marine shipping sector contributes roughly 2% of global GHG emissions, food waste contributes over 8%, and a new report found that the problem is much bigger than previously thought.11 In 2011, the UN Food and Agriculture Organization (FAO) estimated that one-third of all global food production is wasted from farm to fork. The new report from WWF and Tesco revised this to 40% of global food production — and 10% of global GHG emissions — with a comprehensive assessment of on-farm food loss and updated data from losses in supply chains, retail, and consumption.12
The least efficient commodity group is fish and seafood, with almost 50% of production wasted. However, fish and seafood are a small proportion of total waste by weight and GHG contributions. Fruit and vegetables are the largest group by weight (38%), whereas meat and animal products are the largest by GHG contribution (40%).
Looking at the GHG contribution from waste meat and animal products more closely, since 40% of all food waste GHGs come from this commodity group, 4% of global GHG emissions come from meat and animal products that are never eaten. That waste is twice the total GHG emission from the entire marine shipping sector and more than the marine and aviation sectors combined. Waste indeed.
And that is just the GHG emissions. There are other problems with wasting 40% of the food we produce, including the land used to grow the crops and house the animals (land that may have previously been rainforest or other important habitats), water wastage, eutrophication and acidification of aquatic systems from fertilizers, food insecurity, and others.
Many direct and indirect factors lead to food waste. The report highlights seven areas where market and supply chain actors can address some of the underlying issues in food production systems, including:
Measuring and reporting food waste at more granular levels in supply chains
Reconsidering retail product portfolios and consumer awareness of agri-biodiversity — greater crop variety can reduce the prevalence of farmers planting less suited cultivars with high waste rates due to market popularity
Expanding product specifications to allow for flexibility in shape and appearance so produce is not left unharvested, culled during harvest, or used in low-value applications
Paying fair prices with more equitable contractual arrangements and protections from unfair trading practices
Facilitating discussions with cooperatives and farmer associations to improve farm financial security and allow for investment in waste reduction
Strengthening the connection between farmers and end-market requirements by reviewing the role of (need for) brokers and other market structures
Develop a larger number of alternative markets for surplus
They are other ways we can approach the problem with multilateral institutions, governments, and as consumers and citizens.
More than a third of the world’s population faces malnutrition due to the economic and food-system disruptions from the Covid-19 pandemic.13 Crops in the U.S., Canada, Chile, Brazil, Germany, the Henan province of China, and other regions face low yields due to extreme weather events.14
Wasting 40% of global food production is unacceptable.
Let’s get to work.
Have thoughts or feedback? Did I miss anything this week? Email me at kellen.betts@gmail.com. You also can reach me on LinkedIn and Twitter.
Like Sustainable Supply Chains? Never miss an update by subscribing for free!
Help others discover Sustainable Supply Chains by sharing the post with friends and colleagues!
Bonus Reading
What happens if Chinese household wealth is unleashed on the world? by Thomas Hale and Tabby Kinder in Financial Times (free article)
Bootleg Fire is burning up carbon offsets by Daniel Wolfe and Tal Yellin at CNN
A global comparison of the life-cycle greenhouse gas emissions of combustion engine and electric passenger cars by Georg Bieker at ICCT
Global or Local? Insights from 10 companies into the long-term impact of COVID-19 on global supply chains by Xingzhen Ren, et al. at DSV and Cardiff University